
Blog ·
How to read weather radar
Green, yellow and red is where most people stop. Here's what the rest of a radar display is telling you, and how to use it.
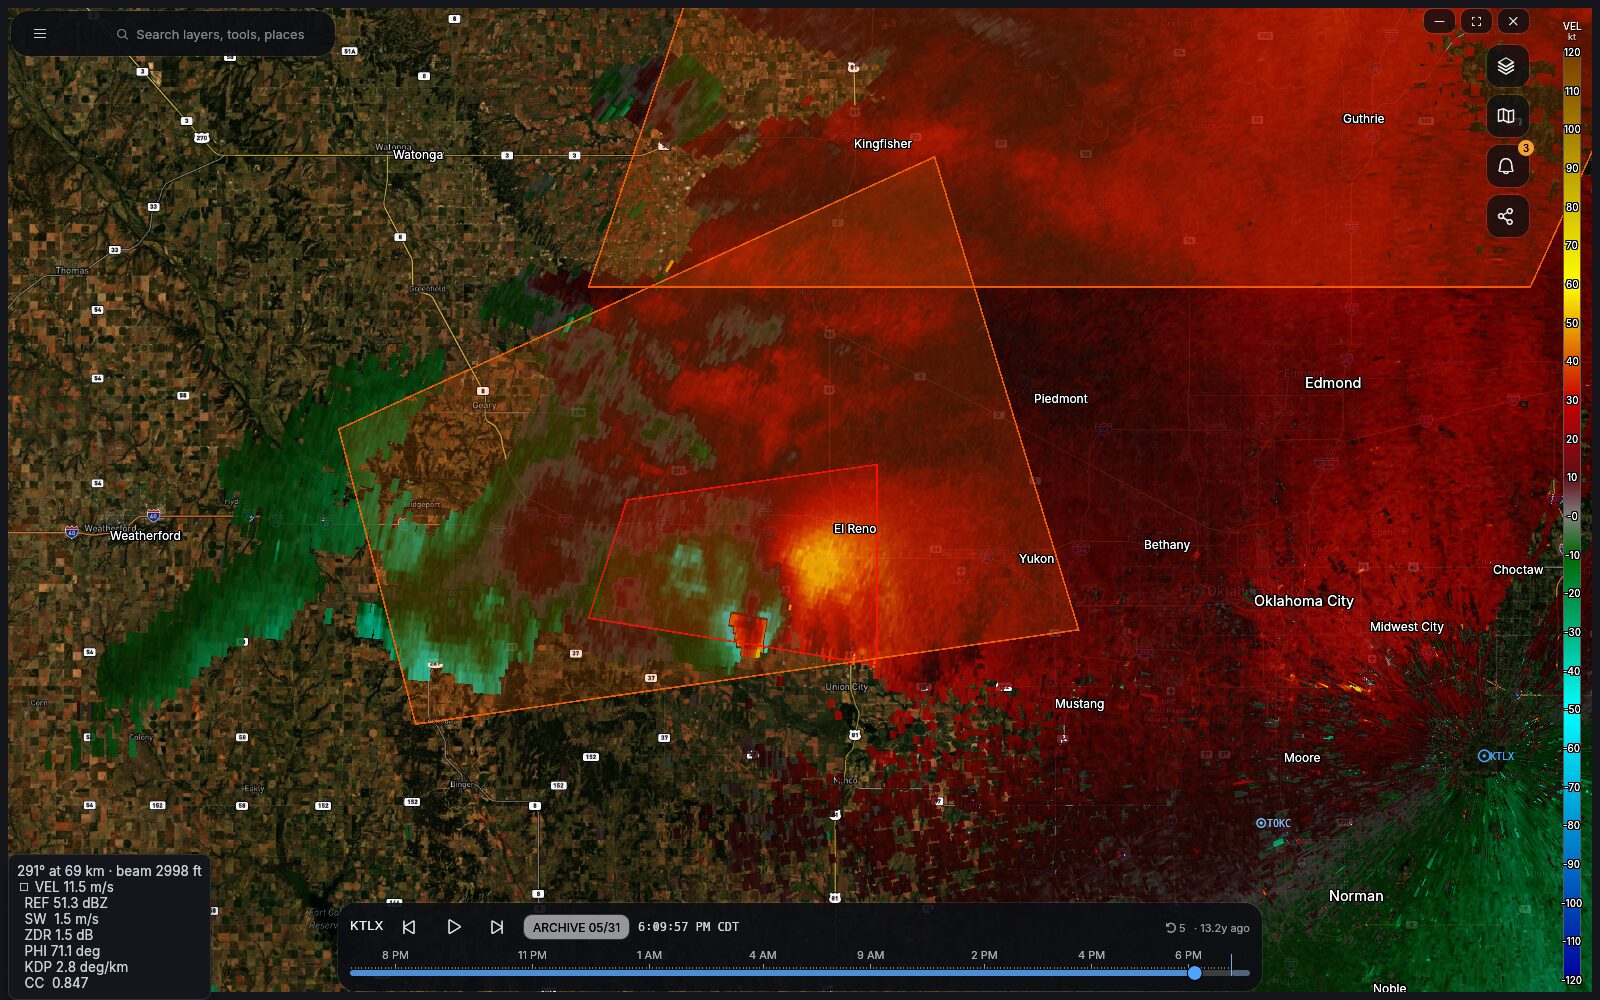
Most people read weather radar exactly one way: green is rain, yellow is more rain, red is get inside. That’s not wrong, and for most weather it’s enough.
But that colour scale is one measurement out of six, and the other five are the ones that tell you whether a storm is dangerous. None of them are hard. Here’s the whole display.
Reflectivity: how much is out there
The familiar one. The radar sends a pulse and measures how much energy comes back, in dBZ. Bigger drops, and more of them, return more.
Under 30 dBZ is drizzle or snow. 35 to 45 is real rain. Over 50 is a downpour and a hail candidate. Over 60 dBZ, in most of the country, is hail — plain water struggles to return that much.
The number is not rainfall rate. It’s a measurement of what’s in the beam, and the beam is somewhere above your head — which is why the radar can show 45 dBZ over a town that’s staying completely dry, when the rain is evaporating on the way down.
Reflectivity’s real use is shape. A round blob is an ordinary shower. A long line with a bowed section is a squall line, and the bow is where the damaging straight-line wind is. And a curl on the back of an isolated storm is a hook echo.
Velocity: what the air is doing
The second product, and the one worth learning.
Radar measures motion along the beam by the Doppler shift: green means the echo is moving toward the radar, red means away. Brightness is speed.
The single most important thing on this display is green and red pressed tight against each other. Air coming at the radar right beside air going away from it is air rotating. That’s a mesocyclone, and it’s the reason tornado warnings get issued before anyone sees anything.
Two catches. First, the radar only sees motion along its own beam, so the picture is oriented around the radar site, not around north — the same wind reads differently on either side of it. Second, above a certain speed the measurement folds over and reads backwards; software undoes that, and it’s called dealiasing. If a couplet looks like nonsense with hard edges, that’s what you’re looking at.
Storm-relative velocity subtracts the storm’s own travel across the ground. A storm moving 50 mph carries its rotation along with it, which smears the signature; subtract the motion and the rotation stands still and becomes obvious.
Correlation coefficient: what it’s made of
Dual-polarization radar sends both a horizontal and a vertical pulse, which lets it ask a different question: does everything in this beam look alike?
Rain does — raindrops are all roughly the same shape — so CC sits near 1.0. Anything mixed drags it down. Melting snow. Hail among rain. Birds and bats and bugs at dusk.
And debris. When a tornado is on the ground it throws fence posts, roof shingles, insulation and trees into the air, and those look nothing like each other. CC collapses in a small blob exactly where the rotation is. That’s the tornado debris signature, and it doesn’t mean a tornado is possible — it means something down there is being destroyed at that moment.
Differential reflectivity: what shape it is
ZDR compares the horizontal return to the vertical one. Falling raindrops flatten into little hamburger buns, wider than tall, so ZDR is positive. Big hailstones tumble as they fall, so on average they’re round, and ZDR drops to near zero.
Enormous reflectivity with ZDR near zero is hail. Enormous reflectivity with high ZDR is a very heavy rain shaft.
Tilts: the third dimension
A radar doesn’t take one picture. It sweeps a full circle, steps the beam up a notch, sweeps again, and keeps going until it has a stack of cones. Each sweep is a tilt, and the stack is a volume.
This matters more than people expect. A storm that rotates at the lowest tilt and nowhere higher is probably not much. A rotating column that stands straight up through five tilts, ten thousand feet deep, is a different animal. And because the beam climbs with distance, a radar 80 miles away is showing you the middle of the storm no matter which tilt you pick — one reason a storm can look harmless on one radar and alarming on the next one over.
Putting it together
The three questions, and the answers:
Is it going to rain on me? Reflectivity, and the loop. Watch which way the echoes are moving, not where they are.
Is there hail? Reflectivity over 50 dBZ, CC dropping, ZDR going flat.
Is there a tornado? A velocity couplet, high reflectivity, and a hole in CC — all three, in the same place, at the lowest tilt.
Try it on a real storm
Reading about this is much worse than doing it. Every archived American storm is free, and HookEcho replays them in your browser: pick 20 May 2013 on KTLX, put reflectivity, velocity, CC and ZDR in four panes, and scrub through the afternoon.
More detail in Reading the radar, and every abbreviation in one place in the glossary.
Comments
Threads live in GitHub Discussions. Signing in uses your GitHub account — we never see a password, and there is nothing to create.